CSE141L Lab 3, Part B: Execution Unit Control and Test
CSE 141L Homepage | Lab Overview | Lab
Description
| Deadline: |
- Preliminary Report (Steps 1-3): Nov. 21 at NOON
- Final Report (All Steps): Dec. 3 at 11:59PM
|
| Changes: |
- 11/25/08: Fixed bug in io_devices.v that prevented simulations from running correctly. Please download the latest version. Not sure if you have the latest version? Check out io_devices.v and make sure that all lines with fscanf in them (there should be 2) start with "rc = fscanf".
- 11/23/08: Extended deadline for final version on Wednesday, December 3 (at 8PM). Good luck!
|
Lab Overview:
Finally, after many weeks of work, it is time to put the remaining pieces together and finish the implementation of your processor.
In the first part of this lab, you created the datapath for your execution. In this part, you will need to implement the
control for your processor and test everything to shake out any bugs you might have. This part will require a significant
amount of work so you should expect to put in some overtime to make sure it is done on time. The AwesomeCore investors are
salivating over the prospects of a great new processor so lets make sure we deliver. Good luck!
Lab Deliverables:
For this part of the lab, you will need to finish up the last major task for your processor: implementing the control for
your backend. After finishing up the control, you will be able to perform functional testing of your processor to make sure
that it is doing what you expect. For the final writeup you will have a chance to optimize your processor so do not
worry about doing that right now. Just make sure everything works correctly. We will hold off on interviewing you until
you have finished optimizing so there will be no demonstration required for this part.
In order to make the work more manageable, there will be two due dates for this part of the lab. A preliminary progress report
with the work from steps 1-3 will be due on Friday, Nov. 21. A full progress report, including all of the steps
will be due on Monday, Dec. 1.
- Demonstration: None
- Progress Report: Once again, there are questions scattered throughout this lab that you should answer for
your progress report. For questions that required a screen capture, make sure you fully describe the screenshot. You
will also need to include all of the Verilog files from your project (*.v, *.tbw, *.ngc, *.mif, *.coe, etc.). Make
sure your code is written in a clear and consistant style with liberal use of comments.
You will need to turn in an electronic copy by on the deadline (note there are 2 deadlines). The answers to the questions should
be in a PDF file. The Verilog files (as well as your PDF) should be included in a ZIP file. Since there are two deadlines
, you should use the following name convention for the preliminary report (steps 1-3, due Nov. 21):
cse141L-lab3-part_b-prelim-lastname1-firstname1-AND-lastname2-firstname2.zip. For the final progress report
(all steps, due Nov. 21), use the same name but leave out the "-prelim-" part. Again, the PDF should have the same naming
convention (just a different file extension).
You will need to e-mail your ZIP file to Sat with the following naming convention for the subject:
[CSE141L] Lab 3, Part B Preliminary Submission - Last Name 1, First Name 1 & Last Name 2, First Name 2. Again,
for the final version, leave out "Preliminary" from the subject line.
Lab Description:
Jump to: Control Logic | Finalize Fetch Unit | Instruction
Set Test | IO Test | Write a Simple Loader | VirtualMachine
Test | Evaulation
Step 1: Control Logic
Complete your execution unit by implementing its control logic. Include the source files in an appendix at the end
of your progress report.
Step 2: Finalize Fetch Unit
If you have not done so already, finalize the implementation of your fetch unit. In order to do this, you will need
to generate a new instruction memory module (tutorial here) with 8K entries (17 bits
each) and a new FIFO module (tutorial here) with 16 entries (30 bits each). Make sure
you include all the files from these modules in your ZIP. Include your fetch.v in the appendix of your progress report.
Step 3: Instruction Set Test
The first thing that you should test in your processor is that all of the instructions in your ISA are operating correctly.
To do this, create an assembly file that uses all of the instructions in your ISA except the in
and out instructions (these instructions will be tested next). Generate a COE file for this program then use
behavioral simulation to verify that your instructions are working correctly. Try to make your assembly program as short
as possible while still covering all the instructions. Include the assembly file for your test program in your progress
report.
| Q1 |
What was your strategy for testing all your instructions? Is there a way to quickly verify that all of the
instructions executed correctly? |
| Q2 |
Include screen captures from at least 3 points in your behavioral simulation. One of these must be for the
end of your program but the rest of the points are of your choosing. Be sure to explain what each of the screen captures
is showing. Also, make sure the captures are zoomed in enough to see actual values and that the labels for the signals
are visible in the capture. |
Important Note:
Everything up to this point should be part of the preliminary report (due on Nov. 21). The following steps will be
part of the final report, which is due on Monday, Dec. 3.
Step 4: IO Test
In your 141 ISA project, you were provided the code for a VirtualMachine function. While the data for your implementation of the
VirtualMachine function resides in your processor, the programs that your VM will run (those written in the SuperGarbage
ISA) are not on chip. To access them, you will need to use the processor's IO interface to talk to an external
device. We have provided you with io_devices.v, an Verilog module for an IO device that
supplied SuperGarbage programs to your processor. Also include in this module is a clock counter that will allow
us to measure your performance when executing a SuperGarbage program. You also have access to top.v
which is a top level module that includes your processor core and the IO devices. Note that you will need to modify
top.v if you did not use the exact core interface given in part 1 of this lab.
The interface of the io_devices module is given below:
module io_devices#(parameter D_WIDTH = 34, PA_WIDTH = 4)
(
	input 	reset,
	input 	clk,

	input	read_req,
	input	write_req,
	input	[PA_WIDTH-1 : 0] read_addr,
	input	[PA_WIDTH-1 : 0] write_addr,
	input	[D_WIDTH-1 : 0] din,
	output	[D_WIDTH-1 : 0] dout,
	output	read_ack,
	output	write_ack
);
The io_devices module provides the following services via I/O channels:
Input Channels:
- #1 : Request the next word of SuperGarbage binary file
- #2 : Request the current clock count
- #3 : Request an input data from "input.txt" file
- others : Reserved
Output Channels
- #1 : Select a SuperGarbage binary file
- #2 : Set clock count
- #3 : Debug output
- others : Reserved
Now that you have an IO device to interact with, you should write a small assembly program to test your in
and out instructions. Include this assembly program as part of the appendices of your progress report.
| Q3 |
Explain how the setup of your IO test. Get a screen capture of the behavioral simulation of this test and
explain the results. |
Step 5: Write a Simple Loader
To run a SuperGarbage program using your VM, your processor first needs to properly load the application into the
data memory. The following figure shows the format of the SuperGarbage binary file and how a loader works. After
selecting the application to load, the loader requests the selected SuperGarbage binary file via input channel #1, word-by-
word. The odd-numbered words contain the address where the following word will be stored. For example, in the figure
below, 'Data 0' will be loaded into address 3 in your data memory. The loader continues loading data until it encounters
the address -1 (0x3FFFFFFFF), which means the end of the file. The word following address -1 is the
starting PC for the SuperGarbage program. After the loader is finished, it should call the VirtualMachine function you
have written.
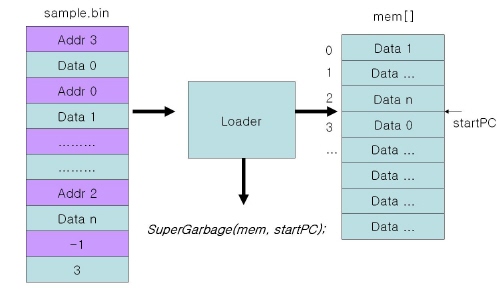
The following Java-esque pseudo-code shows how to load a program from the io_devices module and run the
VirtualMachine. We have provided several SuperGarbage applications for you to test on. Changing the num_app variable
in the pseudo-code will change which of these applications you load. You should write the loader in your assembly language,
build the COE files, and generate a memory module. Be sure to include the assembly code for your loader in an appendix
of your progress report.
// SuperGarbage Loader
// num _app
// 0: app0.bin
// 1: app1.bin
// 2: app2.bin

final int num_app = 0;

word mem[4096];
word startPC;

// basic code stub
set $SP;
set $GP;

// select an app
out( num_app, 1);

// load data from an external device while(addr != -1)
do {
    word addr, data;
    addr = in(0x1);
    data = in(0x1);

    if (addr == 0x3FFFFFFFFL) {
        startPC = data;
        break;

    } else {
        mem[addr] = data;
    }
} while(true);

// Finally, call the virtual machine
VirtualMachine(startPC, mem);
Step 6: VirtualMachine Test
In this lab, you will use the following three SuperGarbage applications to test your design. You will need to put them in
your Xilinx project directory. Applications get inputs from input channel #3, which is fed by the input file. If you want to
change the input data, modify the input file for the corresponding application.
You should now run your loaded with the app0 (Compare) to make sure your loader is working correct.
| Q4 |
Perform a behavioral simulation of your loader using the app0. Get a screencapture of the integer that is
returned from the VirtualMemory function. What was this integer? |
SuperGarbageSim
Although the VM is very simple, it is not easy to understand SuperGarbage code. To help you understand the behavior of
SuperGarbage applications, you are provided with a SuperGarbageSim, a reference simulator for SuperGarbage applications.
SuperGarbageSim can load and execute any SuperGarbage application binary file. You can also monitor or modify contents
of memory and the program counter. The SuperGarbageSim supports the following commands:
- load $file.bin
loads *.bin file and *.in file, and set the $PC to the entry point of the application
- go $number
executes next $number instructions. if $number is not specified, continues execution until a 'halt' instruction is executed.
- step
execute one instruction at the current $PC, and increase $PC.
- get_pc
prints the current $PC value
- set_pc $value
sets the $PC to $value
- disasm $addr $size
disassembles instructions from $addr to $addr + $size
- get_mem $addr $size
prints data memory values from $addr to $addr + $size
- set_mem $addr $value
sets the value at $addr of the memory with the value $value
- count
shows the number of executed instructions
- help
shows a help message
The following files comprise the SuperGarbage simulator. After downloading and compiling them, you
can start the simulator by running the command 'java SuperGarbageSim'.
- Instruction.java
- SuperGarbageSim.java
Here are a few examples of SuperGarbageSim commands:
 prompt> load test1.bin      // load 'test1.bin' file
 prompt> disasm              // disassembles 10 instructions from PC
 prompt> disasm 0x10 15      // disassembles 15 instructions from 0x10
 prompt> set_mem 14 0x0      // set the memory location 14(0xe) to 0x0
| Q5 |
With the aid of SuperGarbageSim, figure out what the final PC of app0 should be. Explain how
you got this number. How does it compare to the integer that was returned in your screen capture as
part of Q4? |
VirtualMachine Performance
All three provided SuperGarbage applications measure their execution times by using the counter service
implemented in io_devices.v. They calculate the execution time by requesting counter value at the
beginning and end of the execution and getting the difference. They then send the number of cycles for the
execution to the debug output channel (output #3) so that you can easily see it.
In order to count the number of instructions executed on your processor, you should add an instruction counter
to your processor. It should be initialized to zero when your processor is reset and incremented after every
successful execution of an instruction.
Note: dmem.v occassionally refuses a request to the memory (for debugging purposes). However, for
testing of the applications, we do not want this to happen. We have therefore provided
dmem_no_refuse.v, which does not refuse requests. When doing performance analysis, use dmem_no_refuse.v
rather than the old dmem.v.
| Q6 |
Run all the benchmark applications and gather the following information for each benchmark:
- Number of execution cycles for the application.
- Dynamic instruction count for your processor (using your counter).
- The Cycles Per Instruction (CPI).
Present this information using a simple table. |
| Q7 |
Why does CPI vary across applications? |
Step 7: Evaluation
Now that you have passed two important tests, let's evaluate the performance of your processor. Perform a post-route
simulation with the testbench you wrote in Step 3 (Instruction Set Test).
| Q8 |
What is the maximum achievable frequency of your processor? Include a screen capture on the post-route simulation
result at that frequency in your hardcopy report. Using this frequency, calculate the execution time for all three
benchmarks. |
| Q9 |
What is the critical path of your processor? Draw the critical path on the datapath schematic you made in part
1 of this lab. |
| Q10 |
Propose one idea for increasing the performance of your processor. Why do you think it is an effective way to
boost the performance? |
Tips & Tricks
The following bits of information may prove invaluable to you while completing this lab.
- It is very painful to generate memory modules every time you modify your binary file. Fortunately, you do not have
to generate a new memory module for behavioral simulations. The output Verilog file of the CORE Generator refers
to a *.mif file for memory contents. Instead of generating new memory modules, you can simply modify your
*.mif file, and perform the behavioral simulation again. It is highly recommended to generate *.mif files
along with *.coe files from your simulator to make the debugging procedure much easier. The following MIF
file is the MIF file for the 17-bit instruction memory you used in your fetch unit. It is similar to *.coe file,
but uses a binary representation.
	00000000000000000
	00000000000000001
	00000000000000010
	00000000000000011
	00000000000000100
	00000000000000101
	00000000000000110
	00000000000000111
	00000000000001000

	 ...........
This lab created by Donghwan Jeon, 2007. Modified by Sat Garcia, 2008.