Suppose you have the following input as Dmitrii outlined in programming assignment #3
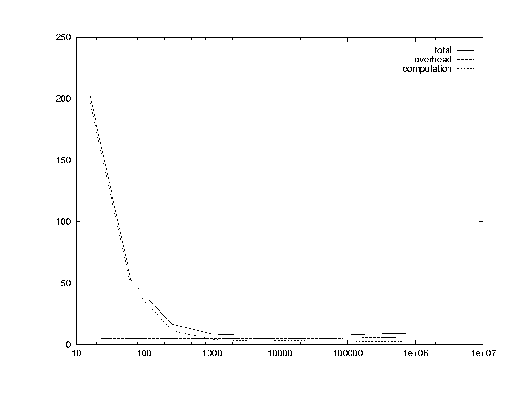
16 202.373523 4.971221 196.666805
64 52.496067 4.805053 47.513897
256 16.433424 4.903209 11.486974
1024 8.610897 4.720053 3.875290
4096 7.629377 4.802822 2.812051
16384 8.034614 4.858580 3.124238
65536 7.695297 4.783406 2.680084
262144 8.753684 5.618053 2.444938
1048576 9.455314 5.062529 2.053595
where the first column is the size of chunks used in your experiments, the second column is the total execution time, the third is the average overhead time, and the fourth is the average computation time. We want to create 3 separate curves 1) total execution time, 2) average overhead time, and 3) average computation time. Here's how you do it in gnuplot.
- Type in 'gnuplot' at the command line. You should see something like the following
        G N U P L O T
        unix version 3.5
        patchlevel 3.50.1.17, 27 Aug 93
        last modified Fri Aug 27 05:21:33 GMT 1993

        Copyright(C) 1986 - 1993   Colin Kelley, Thomas Williams

        Send comments and requests for help to info-gnuplot@dartmouth.edu
        Send bugs, suggestions and mods to csehelp@cs.ucsd.edu

Terminal type set to 'x11'
gnuplot>
- Type in the following:
set logscale x
plot '<infile>' using 1:2 title 'total' with lines, \
     '<infile>' using 1:3 title 'overhead' with lines, \
     '<infile>' using 1:4 title 'computation' with lines
This says the following
- We are using a logscale on the x-axis
- The data as described above is in a file called 'infile'
- We are graphing 3 curves
- using column 1 and column 2
- using column 1 and column 3
- using column 1 and column 4
- We are labeling the curves respectively as
- total
- overhead
- computation
- We are connecting the datapoints together with lines
You should see something like this
I have created a small script that is available in $PUBLIC for you to use that will automate this process. To
use, type
plotit <name of datafile>
It will create a postscript file named <name of datafile>.ps. Basically, instead of putting the output to the screen, it outputs to postscript via the command
set terminal postcript
Also, you'll notice that you don't have to go into gnuplot to use it...you can also use it as follows:
gnuplot <command file>
where <command file>contains a list of gnuplot commands. Also, if you want to zoom in on a certain part of the graph you can use specify a range using my script
plotit -a <xmin> -b <xmax> -c <ymin> -d <ymax> <name of datafile>
or on the command line
plot [xmin:xmax] [ymin:ymax] '<infile>' using 1:2 title 'total' with lines, \
     '<infile>' using 1:3 title 'overhead' with lines, \
     '<infile>' using 1:4 title 'computation' with lines
Additional Info:
- To put a title on your graphs, use the following commands:
set title '<title you want to use>'
show title
- To put a label on the x-axis of your graphs, use the following commands:
set xlabel '<label you want to use>'
show xlabel
- To put a label on the y-axis of your graphs, use the following commands:
set ylabel '<label you want to use>'
show ylabel
- In the plotit script, this corresponds to using the -t, -x, -y options respectively. For example,
plotit -t "" -x "chunk size (elements)" -y "time (seconds)" test.dat
If at anytime you need help with gnuplot while in command line editing mode, type
help <command you want help with>
Also, a gnuplot manual is available here, but the above should be enough information to get you through programming assignment #3.